
The Universal Math Exam Pilot: Using LLMs To Generate Math Test Items
L Burleigh, Jules King, Kennedy Smith, Ulrich Boser, Kumar Garg
Summary
The Universal Math Exam (UME) pilot was launched in response to the growing need for a global, equitable, and culturally inclusive assessment of mathematical ability. Traditional standardized tests often disadvantage students from diverse backgrounds due to cultural bias and curriculum-specific content. To address this, the pilot explored whether artificial intelligence, specifically large language models (LLMs), could generate valid, high-quality math questions that assess core reasoning skills.
The project aimed to develop a minimum viable prototype of a universal math assessment, using Evidence-Centered Design, Item Response Theory, and teacher-reviewed AI-generated items. Two LLMs, DeepSeek R1 and Claude Sonnet, generated over 800 SAT-style questions, which were refined through human-in-the-loop evaluation and pilot-tested with 146 students from four countries.
The pilot yielded two promising results. First, it demonstrated that large language models can generate quality math test items. More than half of the nearly 300 double-scored test questions (reviewed by at least two teachers) received an overall quality score of “3” (on a scale from 1-3) from at least one reviewer.
Second, the UME showed that AI-generated assessments can meaningfully reflect student ability, identifying exceptional math talent across diverse geographic and educational contexts. UME scores significantly positively correlated with both GPA (Kendall Tau = 0.27) and SAT Math scores (Kendall Tau = 0.36), indicating that the test aligns well with established measures of academic and math ability.
Finally, the pilot produced a novel dataset of teacher feedback to AI-generated items, offering new data for benchmarking LLM reasoning in math. Despite promising outcomes, the study highlights ongoing challenges around cultural bias, question difficulty, and sample diversity, areas that future iterations must address to scale a fair, globally-relevant assessment model.
Introduction
Mathematics is essential for success in education, employment, and innovation. In a 2024 report, researchers found that math scores are predictive of earnings in adulthood for children across all races and ethnicities. This long-standing correlation between math achievement and future success underscores the critical role mathematics plays in shaping educational and career outcomes. As the global economy becomes increasingly driven by science, technology, engineering, and mathematics (STEM), the need for a fair and inclusive way to assess mathematical talent has never been more urgent.
Yet existing assessments often fail to equitably measure math proficiency across diverse student populations. Many standardized tests are tied closely to specific curricula, contain culturally unfamiliar contexts, or assume access to particular resources. For instance, seemingly simple references, like yachts, taco trucks, or grass clippings, can unintentionally disadvantage students who have never encountered those scenarios. These details, while meant to add context, can become barriers that obscure the actual mathematical concepts being assessed.
To explore a more inclusive approach, a small pilot initiative was launched to investigate what a Universal Math Exam (UME) might look like in practice. This project aimed to reenvision how math is assessed globally. Rather than conforming to a single education system, the UME was designed to surface core mathematical reasoning skills that are relevant across borders and learner backgrounds.
The pilot focused on developing a minimum viable prototype aimed at testing the feasibility of creating such a universal exam. It draws on established frameworks such as Evidence-Centered Design and Item Response Theory (IRT) to guide content structure and evaluate performance. A key area of investigation was the role of artificial intelligence in supporting question and multiple-choice answer generation, with the hope of reducing the cost and bias of large-scale assessments.
This early-stage effort was not meant to produce a finished product, but rather to test foundational ideas and technical strategies. Could AI meaningfully contribute to high-quality item creation? Could a global assessment maintain validity across students from widely differing contexts? Could the exam be rigorous enough to serve as a benchmark for advanced proficiency while remaining inclusive in its design?
Initial findings suggest that further development may be promising, while also highlighting key questions for future investigation. Overall, the pilot lays essential groundwork for deeper inquiry into how universal assessments might more accurately and equitably recognize mathematical potential, wherever it is found.
Methods
Question Generation
The test content for the UME pilot was created leveraging recent advances in large language models (LLMs) and their emerging reasoning capabilities. Rather than relying on complex fine-tuning procedures, the project team employed a more scalable and efficient approach known as in-context learning. This method involved providing the models with a series of prompt-based instructions and reference examples, enabling them to generate high-quality multiple-choice question stems and answer choices that aligned with the rigor and structure of the SAT.
An internal evaluation was conducted to determine which models should be used for item generation in the pilot, ensuring quality and validity. The evaluation employed an LLM-as-a-judge framework, where models’ generated questions were compared in a series of pairwise tasks. Questions were assessed for quality based on how well the overall question and the answer choices reflected the knowledge and skill being tested.
In this evaluation, four models, DeepSeek R1, GPT-4o, Claude 3.5 Sonnet, and Gemini 2.0 Flash, were prompted to generate multiple-choice questions aligned to tasks within two SAT math domains: Algebra and Problem Solving and Data Analysis. A total of 449 model-generated questions were collected, grouped by the SAT domain and skill area, and evaluated through 239 pairwise comparisons using an LLM-as-a-judge approach. In each comparison, two anonymized questions were shown side-by-side, and a model selected the better question to derive win rates. The order of presentation was randomized to mitigate known positioning bias and to balance the comparisons to ensure even distribution across model outputs. Each of the four models served as a judge at different points in the evaluation to reduce the risk of self-enhancement bias.
The evaluation revealed important performance distinctions. DeepSeek R1 emerged as a strong performer, winning head-to-head comparisons against all three other models tested. It outscored GPT-4o with a 64.1% win rate (n = 39), Gemini 2.0 Flash with 57.5% (n = 40), and Claude 3.5 Sonnet with 53.8% (n = 39). These results suggest DeepSeek’s effectiveness in generating mathematically sound and well-structured questions, especially in tasks involving reasoning and precision. Claude 3.5 Sonnet also performed well, narrowly edging out GPT-4o and Gemini in their respective matchups. While GPT-4o remained competitive, it trailed in all direct comparisons (Appendix A).
In a complementary evaluation, models were also asked to assign numeric scores to questions using a draft of the Universal Math Exam Question Rubric used by teachers later on to evaluate the questions. The results showed that DeepSeek performed marginally better than the other models (Appendix A). As a result, DeepSeek R1 and Claude Sonnet were selected for final question generation. DeepSeek R1 generated 520 questions and 490 sets of distractors, while Claude Sonnet generated 280 questions and 310 sets of distractors for a total of 800 AI-generated questions for evaluation.
To guide question generation effectively, the team selected two high-quality reference datasets, Qazuntv2 (n = 911) and SemEval (n = 3,700). These were chosen from a larger pool for their strong alignment with the SAT’s difficulty level and question design. Each question generated by the models was tagged using a task label taxonomy derived from the SAT framework, ensuring that the content addressed a comprehensive range of mathematical skills.
The item generation process followed a systematic and iterative approach of snowball generation. First, questions in the reference datasets were labeled by content domain, skill category, and learning objective. For each skill category, one example question from the reference dataset was chosen as the seed question. Each seed question was used to generate more questions in the same skill category iteratively, where the cumulated set of generated answers was fed into the model as reference questions in each iteration. The model was guided to generate new questions that were meaningfully different from, but still complementary to, the cumulatively generated question set.
Once a new question was created, a model was used to generate three plausible distractors by providing the question stem with the correct answer and being prompted to write high-quality incorrect answer choices by identifying misconceptions or mistakes a student could make if lacking the knowledge to identify the correct answer. Gemini Flash 2.0 was then used to ensure consistent formatting across all items. This structured process produced a well-balanced distribution of items that mirrored the content makeup of the SAT, with approximately 35 percent from Algebra, 35 percent from Advanced Math, 15 percent from Problem-Solving and Data Analysis, and 15 percent from Geometry and Trigonometry.
Teacher Evaluation of Questions
After generating 800 questions, the questions were manually reviewed for cultural biases by The Learning Agency’s R&D team and by at least one expert teacher. Questions that were flagged as containing cultural bias (n = 53) or that required a visualization, as determined by the learning objective (additional n = 36), were removed. A team of experienced teachers then conducted a thorough review of each of the remaining 711 items, first participating in a training session to ensure consistency and accuracy in their assessments. Each question was then rated on four dimensions: overall quality, stem topic, stem vocabulary, and answer choices, using a three-point scale: 1 - Needs Major Improvement, 2 - Needs Minor Improvement, and 3 - Satisfactory. Items rated a 3 were accepted as-is, while those receiving a 2 were revised, and those receiving a 1 were “thrown out” and not used for the pilot. If a question received an overall score of 2 from both teachers, or a 3 from one and a 2 from the other, it was escalated to an adjudicator (n = 146) with experience in SAT question development. The adjudicator reviewed the flagged items and selected the best version for inclusion.
Items with an overall score of 3 or 2 were identified as options to include in the pilot exam, with the appropriate revisions. A total of 46 items were selected to include in the pilot exam bank.
Student Recruitment, Participation, and Demographics
Renaissance and The Learning Agency engaged teachers and students in the recruitment process. By reaching out directly to teachers and engaging them in the recruitment process, the team aimed to identify a diverse and robust group of students. A broad outreach campaign was launched through professional networks, Google Groups, social media, and referrals, with a goal of recruiting students across the world.
The pilot was administered in two separate rounds, each conducted during a different time window to provide multiple opportunities for interested students to participate in the exam. Over 200 students signed up for round one of the pilot, which took place in March 2025, with 99 completing the exam. In the second round of the pilot, which took place in April 2025, outreach resulted in 59 sign-ups and 47 exam completions.
The pilot included a total of 146 student participants, ages 14 to 20 (x̄ = 16.74; s = 1.15), from diverse international backgrounds, with students based in the United States (n = 107),
Egypt (n = 30), China (n = 8), and Nigeria (n = 1). Academically, 69 students had an unweighted GPA of 4.0, while 77 had unweighted GPAs between 2.99 and 3.99 (x̄ = 3.87; s = 0.21). Most participants had strong math backgrounds, with 136 students completing four or more math courses. In terms of advanced coursework, 73 students had taken at least one AP math course, while 73 had not.
Student Grouping and Test Administration
To participate in the pilot, all students were required to submit a signed permission form. Students were then grouped by test difficulty, using their prior experience with AP-level coursework as a proxy for their familiarity with complex mathematical reasoning:
Easy Pilot Group: Students with no prior AP coursework.
Medium Pilot Group: Students who had completed one AP course.
Hard Pilot Group: Students who had completed two to four AP courses.
Test difficulty was differentiated by the proportion of Advanced Math content, which measured the skills needed to progress to higher-level math courses. For reference, the SAT includes approximately 35 percent Algebra, 35 percent Advanced Math, 15 percent Problem Solving and Data Analysis, and 15 percent Geometry and Trigonometry.
The medium pilot group maintained a content distribution similar to that of the SAT, assuming that prior experience in one AP course provided a comparable skill level to that required for the standard SAT. In this group, approximately 35 percent of the content focused on Advanced Math, while about 22 percent covered Algebra, Problem Solving and Data Analysis, and Geometry and Trigonometry.
The hard pilot group, reflecting a higher skill level, increased the Advanced Math content to approximately 50 percent, with the remaining 16 percent dedicated to Algebra, Problem Solving and Data Analysis, and Geometry and Trigonometry.
In contrast, the easy pilot group, aligned to a lower skill level, reduced Advanced Math content to about 20 percent, while increasing coverage of Algebra, Problem Solving and Data Analysis, and Geometry and Trigonometry to around 27 percent.
Based on initial feedback from participating teachers who noted that many of the AI-generated questions required more time to solve, the first version of the exam included 20 questions with a 2-hour time limit.
However, pilot data showed that students were completing the exam more quickly than expected. In response, a second version was introduced with 30 questions, while maintaining the 2-hour time limit. Continued monitoring revealed that students were still finishing early, so a final version was released with 40 questions and a reduced time limit of 1 hour and 45 minutes.
A total of 146 students participated in the pilot across all versions:
72 students took Version 1 (20 questions, 2 hours)
28 students took Version 2 (30 questions, 2 hours)
46 students took Version 3 (40 questions, 1 hour and 45 minutes)
Version 1 of the pilot drew questions from a bank of 26 items, while Version 2 used a bank of 39, and Version 3 drew from a bank of 46. The initial bank of 26 items was retained and expanded on for subsequent Versions, such that all Versions included the maximum amount of the same items available. The relatively small question banks ensured that each item would be seen by multiple students, supporting more robust analysis. Questions were randomly assigned by the secure online testing platform, Synap, with content distribution aligned to the designated test difficulty group.
Despite the variation in test length and difficulty, the testing experience was designed to be consistent across all rounds. To maintain the integrity of the assessment, the team administered the UME test through Synap with a lockdown browser. This browser monitored student activity and automatically froze the test if students attempted to click outside the test window or open a new tab. These actions triggered an immediate review process before the test could resume, ensuring the results accurately reflected student ability without outside interference.
Students could freely navigate between questions and utilize the digital scientific calculator provided or their own physical calculator, but were required to complete the exam within the allotted time. They were also encouraged to complete the exam in a quiet, distraction-free environment.
Each student also had to verify their identity, which was approached differently for each round of the exam or time period during which the pilot was administered. In Round 1, which took place in March 2025, identity checks were conducted after the exam. In Round 2, which took place in April 2025, identity verification was completed before the exam began. This change was made to improve the efficiency and the open availability of the software.
After completing the exam, students filled out a post-exam survey to share their experience with the pilot and their views on math in general.
Results
UME Pilot vs Standard Performance Scores
UME pilot exam scores were evaluated in relation to standard student performance scores, including GPA and SAT Math scores, via correlations to assess the pilot’s validity as a measure of academic ability.
Of the 146 students who took the pilot exam, 145 students provided their GPA. A Kendall Tau correlation analysis between the students’ unweighted GPA on a 4.0 scale and the proportion of questions answered correctly in the UME pilot showed a significant, positive correlation (τ = 0.27, p < 0.001), suggesting the exam aligned well with overall student academic achievement (see Table 1 and Figure 1).
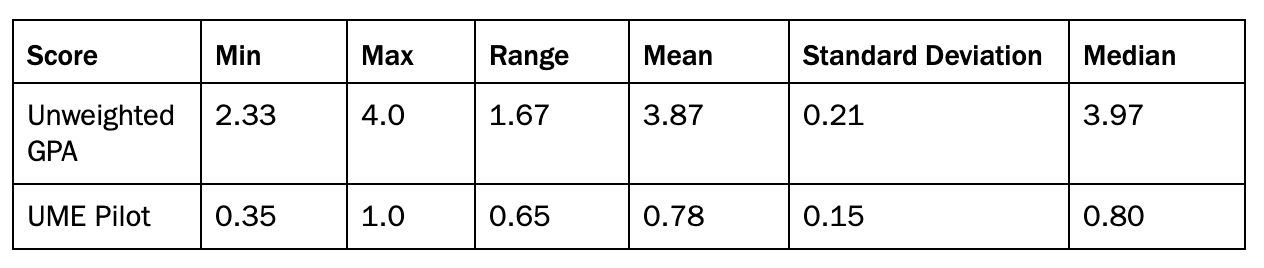
Table 1. Descriptive statistics of the 145 students who submitted a GPA and the proportion of UME pilot exam questions answered correctly by the students.
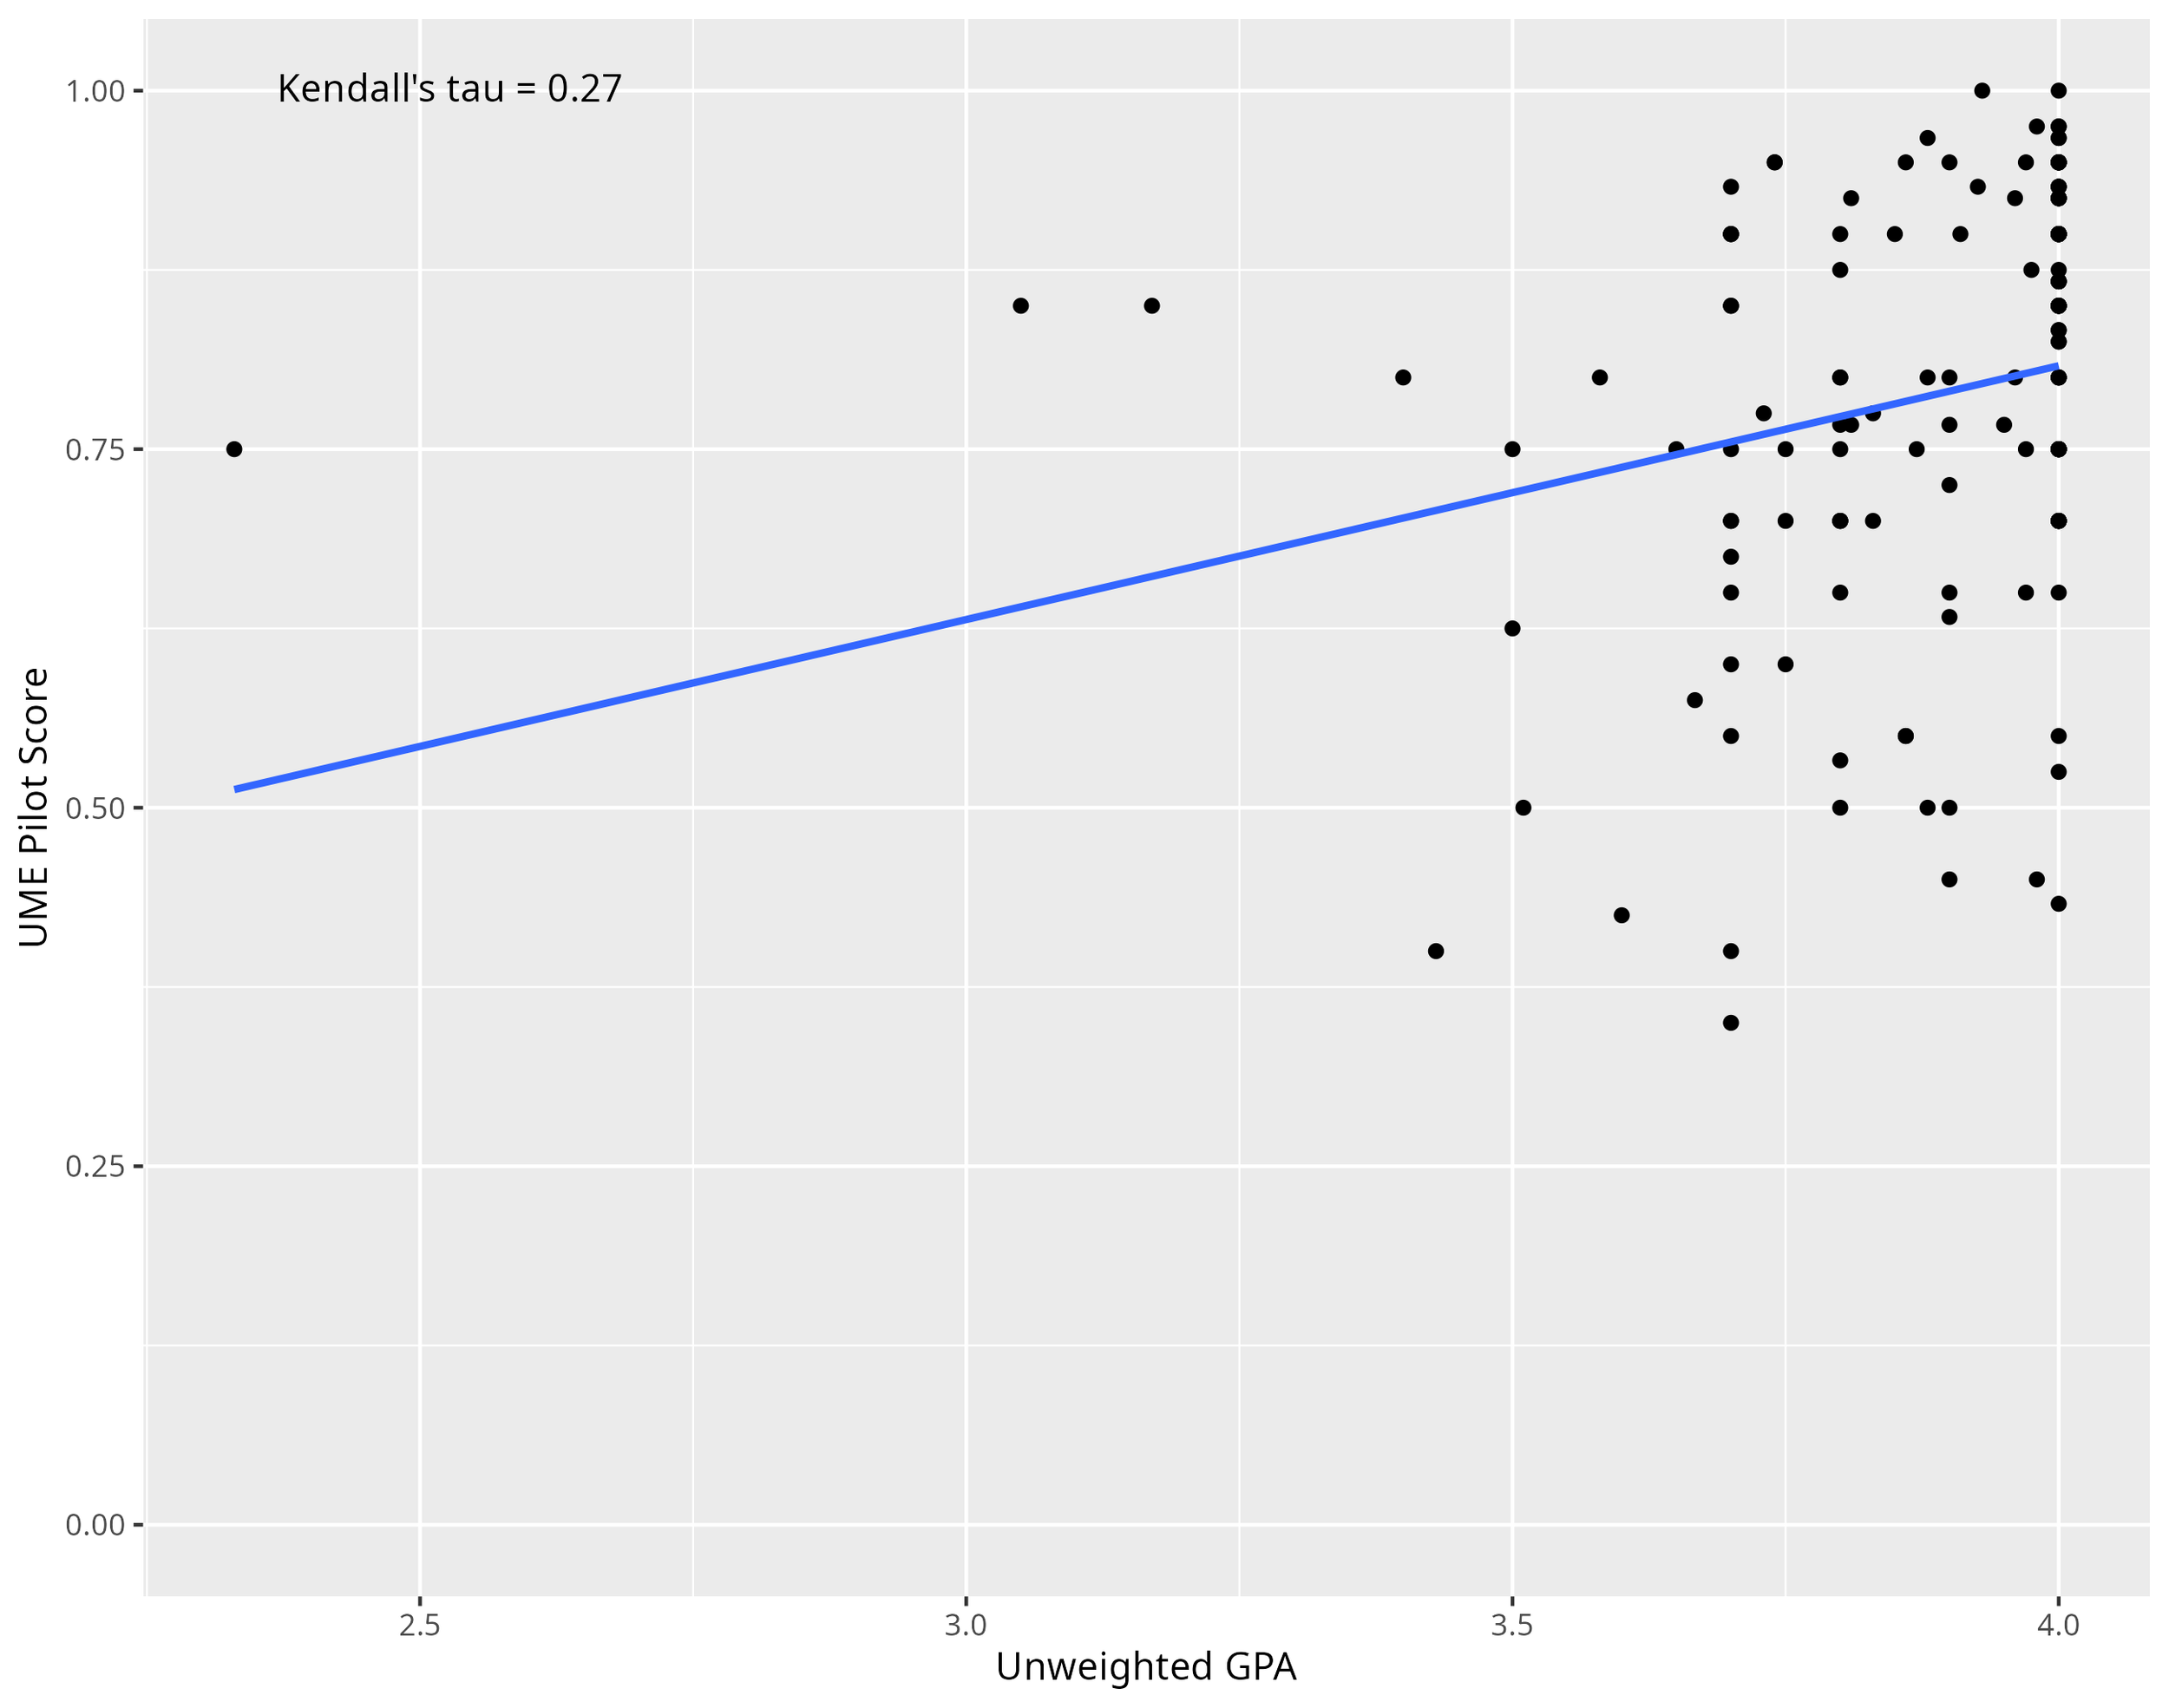
Figure 1. Scatter plot of the 145 students’ unweighted GPA and their respective UME Pilot score (proportion of questions answered correctly). The blue line represents the Kendall tau correlation coefficient, labeled in the top left corner.
Of the 146 students who took the pilot exam, 98 students provided their SAT or ACT Math score. For students who provided an ACT Math score only, their ACT Math score was converted to the SAT Math equivalent score using the ACT’s ACT Math to SAT Math score conversion table (Table B2 in the provided link). Pre-SAT/ACT Math scores, such as PSAT, NMSQT, PSAT10, etc., were also included as SAT Math scores for students who have not yet formally taken the SAT. The particular benefit of assessing the SAT Math score is the focus on math as it more directly relates to the UME pilot, which is composed of math questions, than GPA, which is an overall measure of academic performance, as it includes all subjects and courses a student has taken. A Kendall Tau correlation analysis between the students’ SAT Math score and the proportion of questions answered correctly in the UME pilot showed a significant, positive correlation (τ = 0.36, p < 0.001), suggesting the exam aligned well with students’ academic math performance (see Table 2 and Figure 2).
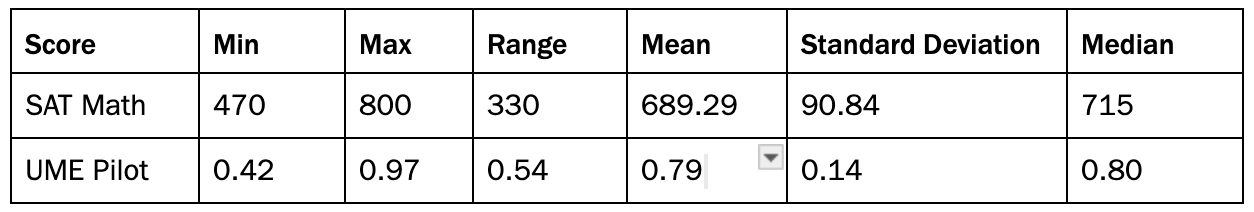
Table 2. Descriptive statistics of the 98 students who submitted a Math SAT or ACT score and the proportion of UME pilot exam questions answered correctly by these students. For instances where only ACT Math scores were available for a student, the ACT Math score was converted to an equivalent SAT Math score. For reference, possible SAT Math scores fall between 200-800.
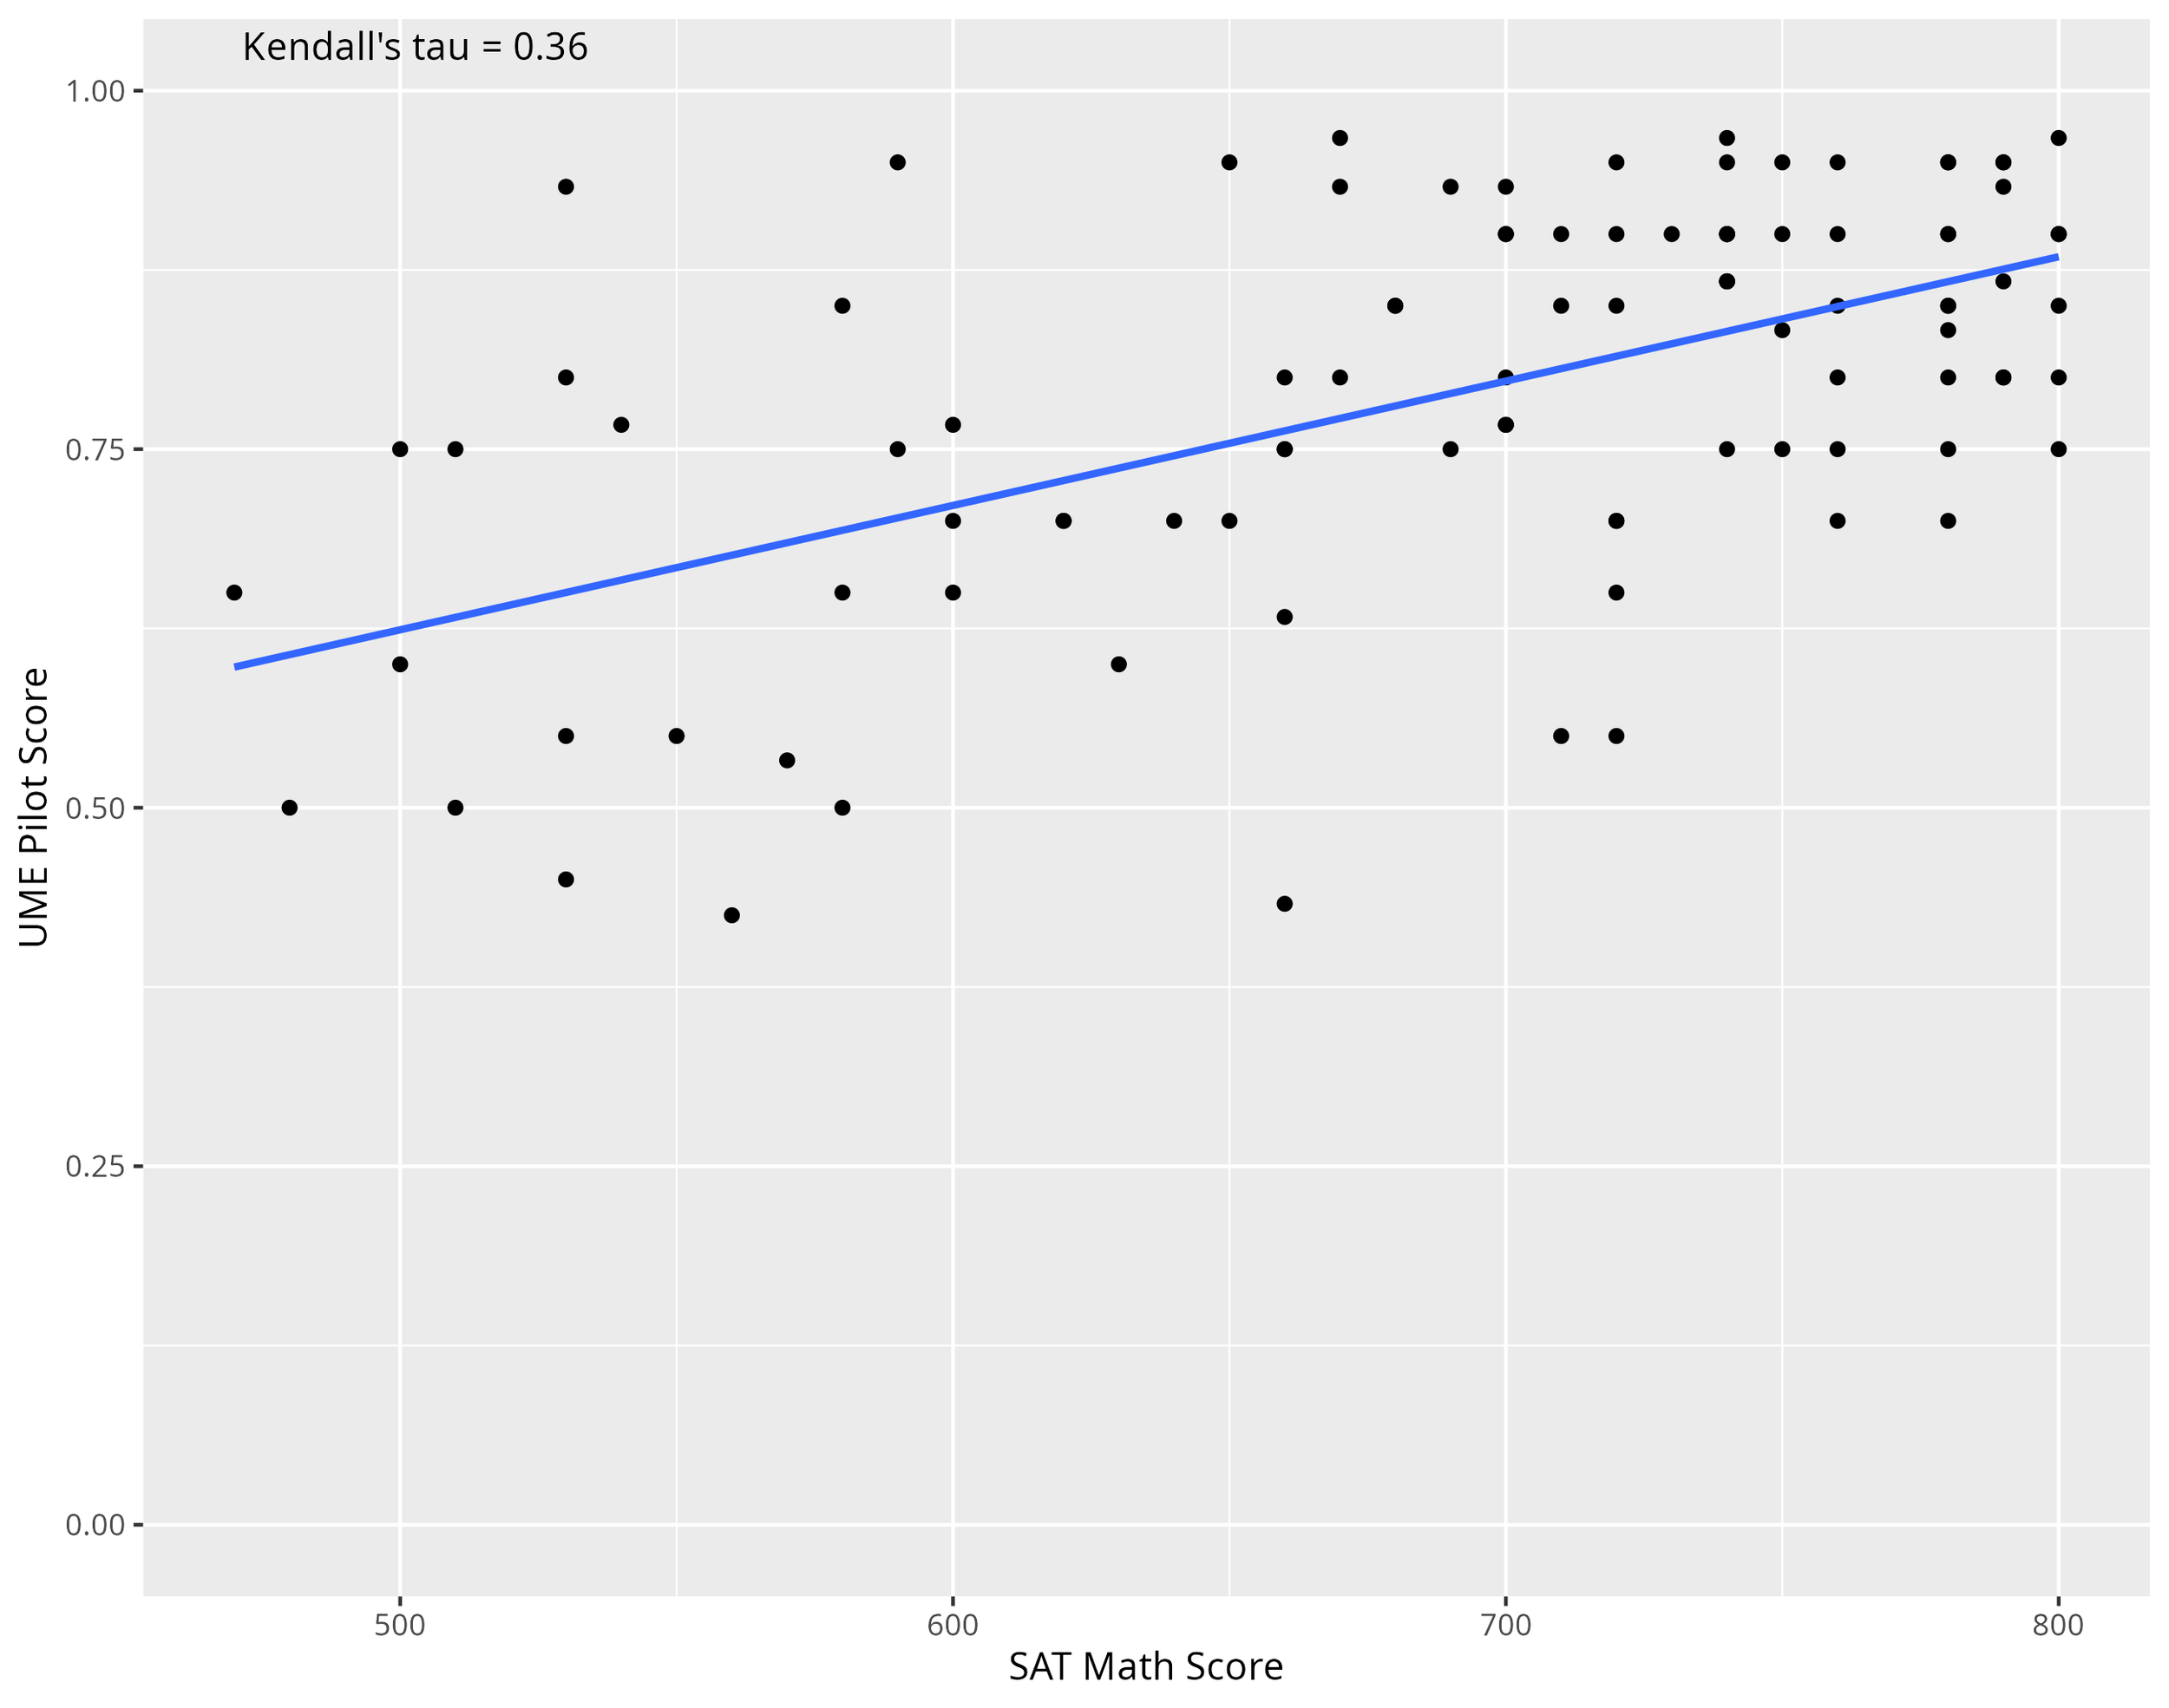
Figure 2. Scatter plot of the 98 students’ Math SAT score and their respective UME Pilot score (proportion of questions answered correctly). The blue line represents the Kendall tau correlation coefficient, labeled in the top left corner.
While the results here are of modest strength, the associations can be partly attributed to the design of the UME, which features a small number of questions spanning a wide range of mathematical topics. This breadth introduces variability, making it difficult for any one academic metric, such as GPA or SAT Math, to serve as a strong predictor of performance. GPA reflects overall academic achievement and general test-taking ability, while the UME targets more specialized mathematical reasoning that may not directly align with typical classroom content or standardized tests. Although the UME and SAT Math both assess math skills, the SAT introduces additional testing variables such as extended duration, multiple subject areas assessed in one sitting, and heightened test-day pressure that may impact performance in ways not present in the UME.
Exam Performance by Test Form Length and Difficulty
Overall, test takers demonstrated moderate proficiency across all versions of the exam, with an average score of approximately 79 percent.
When breaking down performance by test length and difficulty, the 20-item forms showed scores ranging from about 78 percent on the easiest version to 83 percent on the hardest version. The 30-item forms had slightly higher scores, increasing from around 77 percent on the easiest to nearly 89 percent on the hardest. The 40-item forms showed the widest range of scores, with the easiest form averaging about 69 percent and the hardest form reaching approximately 96 percent.
A notable pattern emerged with the hardest 40-item form, where scores were very high and showed little variation among examinees, suggesting a ceiling effect. This indicates that many test takers found this version relatively easy, leading to scores clustering near the top. Conversely, the easiest 40-item form had the lowest average scores and the greatest variability, suggesting that some examinees continued to face challenges with these items. The medium-length forms, including both 20- and 30-item versions, clustered in the low to mid-80 percent range with moderate variation, reflecting more consistent performance across examinees. In more simplified terms, this generally means the test was more challenging for students with no AP courses and easier for students with more AP courses, which aligns with expectations.
Additionally, certain “anchor items” were included across all test forms to help compare results. As expected, the average scores on these anchor items increased with the difficulty level of the exam, indicating that higher-difficulty forms were typically taken by more proficient examinees. Specifically, average scores on these items were approximately 75 percent on easy forms, 80 percent on medium forms, and 88 percent on hard forms.
Item Level Analyses
Classical Test Theory Corrected Item Total Correlations (CITC) evaluated how well each item correlates with the total score of the rest of the items. A higher CITC means the item is more consistent with the overall construct being measured. CITC ranged from -.13 to .69, with 84% of items exceeding the threshold of 0.10, which means that most test items performed acceptably well. Additionally, the reliability of the examination was evaluated by estimating Cronbach’s α, which was found to be 0.874, demonstrating a high level of internal consistency among the items.
An Item Response Theory (IRT) analysis was run for the questions as well. In IRT, difficulty parameters indicate how challenging an item is. The logit scale is the unit used to measure difficulty. Estimated item difficulties spanned -4.24 to .02 on the logit scale. A difficulty of -4.24 means the item is very easy (respondents with very low ability can get it right). A difficulty of 0.02 means the item is close to average difficulty. IRT analysis shows that the test had mostly easy to moderately difficult items.
Further analyses of the Test Information Function and Conditional Standard Error of Measurement determine the best-suited group of examinees. Through these tests, the UME was determined to provide the most precise measurement for examinees whose ability level is about 1.6 standard deviations below the average. This means the test is especially reliable for individuals with slightly below average ability. In this ability range, the test offers the greatest amount of information, which corresponds to the highest measurement accuracy. At the same time, the standard error of measurement, the margin of error in an examinee’s score, is at its lowest, further indicating that the test is most dependable when assessing people in this ability range.
Discussion
The Universal Math Exam Pilot sought to develop a minimum viable prototype aimed at testing the feasibility of using artificial intelligence in supporting question generation, as well as observing if a universal exam could be inclusively designed, maintaining validity across students from differing contexts
The pilot yielded several promising results. First, it demonstrated that large language models can generate quality math test items. More than half of the nearly 300 double-scored test questions (reviewed by at least two teachers) received an overall quality score of “3” (on a scale from 1-3) from at least one reviewer. Teachers provided feedback through a “human-in-the-loop” process, where their insights were used to refine AI-generated questions before final inclusion in the exam. This iterative model resulted in 84% of test items exceeding the threshold for internal consistency, supporting the reliability of the test as a cohesive and valid measure of mathematical ability.
Second, the UME showed that AI-generated assessments can meaningfully reflect student ability, identifying exceptional math talent across diverse geographic and educational contexts. UME scores significantly positively correlated with both GPA (Kendall Tau = 0.27) and SAT Math scores (Kendall Tau = 0.36), indicating that the test aligns well with established measures of academic and math ability. Although these are relatively low correlation strengths, indicating only modest associations. This relationship was consistent across a broad range of students, suggesting that the UME effectively distinguishes high-achieving students from others regardless of their educational background or learning environment.
Beyond the test results, the pilot also created a robust dataset of AI-generated math items with math teacher feedback, available here. Developed with input from experienced educators, the dataset reflects real-world reasoning tasks and pedagogical soundness. This resource lays a foundation for future iterations of the exam to use AI for more complex tasks, including: evaluating item difficulty, fairness, and effectiveness; estimating a student’s knowledge level based on their test responses; identifying potential disparities in item performance across different student groups; and analyzing the impact of external factors, such as geography and prior math exposure, on student performance.
Additionally, it developed rigorous benchmarks to assess the capabilities of reasoning-based large language models (LLMs) in mathematics. These models represent one of the most rapidly advancing areas of AI, yet there remains a lack of high-quality data evaluating their ability to generate effective math multiple-choice questions, particularly with regard to crafting plausible distractors. This work addresses this gap by systematically evaluating top-performing reasoning LLMs across a wide range of math topics. Unlike existing datasets, the team’s data provides teacher feedback on how models perform across specific mathematical skills, offering new insight into where these models excel and where they fall short.
Limitations and Future Directions
While UME marked a promising first step toward the long-term goal of creating a globally relevant, AI-powered math exam, the pilot also revealed key limitations that must be addressed in future research. Five key areas have been identified to drive improvement. Although the strategies were implemented to mitigate these issues during the pilot, they remain substantial barriers to scaling AI-driven assessments effectively. Future work will need to prioritize the development and sharing of diverse, open-access datasets and curricular materials, alongside processes for detecting and minimizing bias. Rigorous validation methods and sustained cross-sector collaboration will also be essential to ensure that future assessments are equitable, reliable, and accessible across global contexts.
Curriculum and Data Availability for AI Training
One of the core challenges in expanding the UME involves access to high-quality curriculum materials. Although international programs like the International Baccalaureate and other advanced math curricula offer relevant content, data on their test items and validation processes are often proprietary and difficult to obtain. Collaborating with these organizations will be necessary to integrate their materials into future iterations of the UME. Additionally, many of the most rigorous curriculum resources are not freely available, limiting the ability of researchers to prototype new assessment models. Identifying open-access alternatives and developing strategic partnerships will be essential to training AI systems capable of generating reliable and advanced math assessments.
Cultural Bias
Cultural bias remains a key issue in the development of a truly international exam. Standardized test items often include references that are specific to a particular region or culture, which can unintentionally disadvantage students from other backgrounds. For instance, a math question based on U.S. currency or the AM/PM time format may be confusing or unfamiliar to learners in other parts of the world. These kinds of biases can distort a student's actual mathematical ability and lead to unfair outcomes. Because LLMs do not inherently detect or correct for cultural bias, extra care is needed during the design and review process. Engaging educators from diverse contexts and subjecting questions to careful validation can help ensure that assessments are culturally inclusive and equitable for all learners.
Further Research on Reasoning LLMs via Benchmark Dataset
Looking beyond the immediate goals of the pilot, the AI-generated questions present a unique opportunity to develop a benchmark dataset for evaluating the reasoning abilities of large language models in mathematics. Uniquely, this dataset includes qualitative feedback from experienced teachers on how to improve each question, something that, to our knowledge, does not currently exist in similar datasets. These teacher-provided insights offer valuable context on question quality, clarity, and alignment with learning goals, enhancing the dataset’s utility. As models like DeepSeek continue to advance, this dataset will support research into both the strengths and limitations of AI-generated assessments. It can serve as a valuable resource for developers, researchers, and educators working to harness AI in the service of more effective and scalable educational tools.
Improvement of Question Bank
During the analysis, 16 of the 46 items used for the pilot were flagged based on Classical Test Theory criteria, specifically items with very low or very high difficulty, as well as through Item Response Theory fit statistics, where items showed significant misfit. Based on these findings, the team recommends four key actions. First, a thorough content review should be conducted to revise or replace items that exhibit low discrimination or poor fit, ensuring each question accurately measures the intended skills. Second, expanding the item bank with additional higher difficulty questions would improve the test’s ability to differentiate among more able examinees and reduce ceiling effects observed in some forms. Third, future iterations should ensure equal representation of high and low performers, since our test-taker pool was mostly higher-achieving students, and the generated questions were suited toward lower-achieving students. Finally, future analyses should include Differential Item Functioning studies across gender and language groups to assess and ensure fairness and equity in item performance across diverse populations.
Sample Size Growth
While our sample size was appropriate for a pilot test, scaling the assessment for classroom readiness will require a larger and more diverse group of respondents. In particular, our current sample skewed toward high-achieving students, which is not unexpected given the voluntary nature of participation. To ensure broader applicability and equity, future testing phases should include a wider range of student achievement levels and learning profiles.
Conclusion
The Universal Math Exam pilot suggests how AI can be harnessed to create high-quality, equitable educational assessments. By combining language models with expert educator human-in-the-loop oversight, the pilot established that AI-generated math questions can meet academic standards and be effectively tailored to diverse learners.
This initial pilot provides a foundation for future development, one that could incorporate even more sophisticated AI techniques to enhance fairness, adaptability, and diagnostic precision. The approach also offers meaningful cost savings by reducing the time and resources required to author and validate test content at scale.
Acknowledgements
The following section highlights the individuals who contributed to the development of this report:
L Burleigh
L Burleigh has a background in statistical data analysis and human behavior research, focusing on cognition and learning. Before joining The Learning Agency, they performed research and data analysis in cognitive neuroscience as a graduate quantitative researcher, investigating analytic assumptions and performing statistical analyses in machine and transfer learning algorithms, fear learning, and generalization of knowledge. Within The Learning Agency, L focuses on statistical data analytics and modeling, current data and AI research, and assessing datasets and AI algorithms. L holds a B.S. in Psychology from the University of New Orleans and a Ph.D. in Cognitive and Brain Science from Louisiana State University.
Jules King
Jules has a strong background in research, development, and project management. Prior to joining the Learning Agency, she worked in different analyst roles across the federal, state, and non-profit sectors. Her work has informed the heads of government agencies and has even been included in the Presidential Daily Briefing. Jules found her passion for education while advocating for student veteran and career counseling programs at UNC Wilmington, where she received her B.A in Criminology and Psychology with a minor in Neuroscience. She additionally has a love of travel and foreign languages and can speak Spanish, French, Arabic and Darija.
Perpetual Baffour
Perpetual brings experience in machine learning, data analytics, and education research. Previously, she was a data analyst for the Office of Evaluation, Research, and Accountability at the School District of Philadelphia. She also served as a research associate at the Center for American Progress and an Emerson Fellow of National Policy for the University of Pennsylvania's Netter Center for Community Partnerships.
Kennedy Smith
Kennedy has a background in academic research, data analytics, and writing. Prior to joining The Learning Agency, she worked as a research assistant in a biological and social science lab, and as a scientific writer in the pharmaceutical industry, where her work contributed to therapeutic drug development for various illnesses. Kennedy holds a BA in Psychology from George Washington University.
Ulrich Boser
Ulrich Boser is a founder, writer, and researcher. He is the CEO of The Learning Agency, one of the nation’s leading education innovation organizations. Under his leadership, The Learning Agency developed and executes the world’s largest ed tech competition, among many other things.
Kumar Garg
Kumar Garg is the President at Renaissance Philanthropy. Kumar has helped to shape the science and tech landscape for almost two decades. Working with Eric Schmidt, he helped design and launch moonshot initiatives in education, provided early support to game-changing ideas and pioneers, and built ongoing multi-donor and multi-sector collaboratives.
[1] Modest association levels can be partially explained by the nature of the UME itself: it includes a limited number of questions and covers a broad range of mathematical concepts, which introduces variability and makes it harder for any single background metric (like GPA or SAT Math) to strongly predict performance. Additionally, GPA scores capture general academic ability and test-taking skills, whereas the UME is designed to probe more specialized or nuanced mathematical reasoning that may not be directly aligned with what students typically encounter in school or standardized testing. While SAT Math and the UME share the same subject focus, confounding testing variables are introduced in SAT taking that were not factors in the UME such as longer test times, additional subjects being tested in the same sitting, and increased pressure.